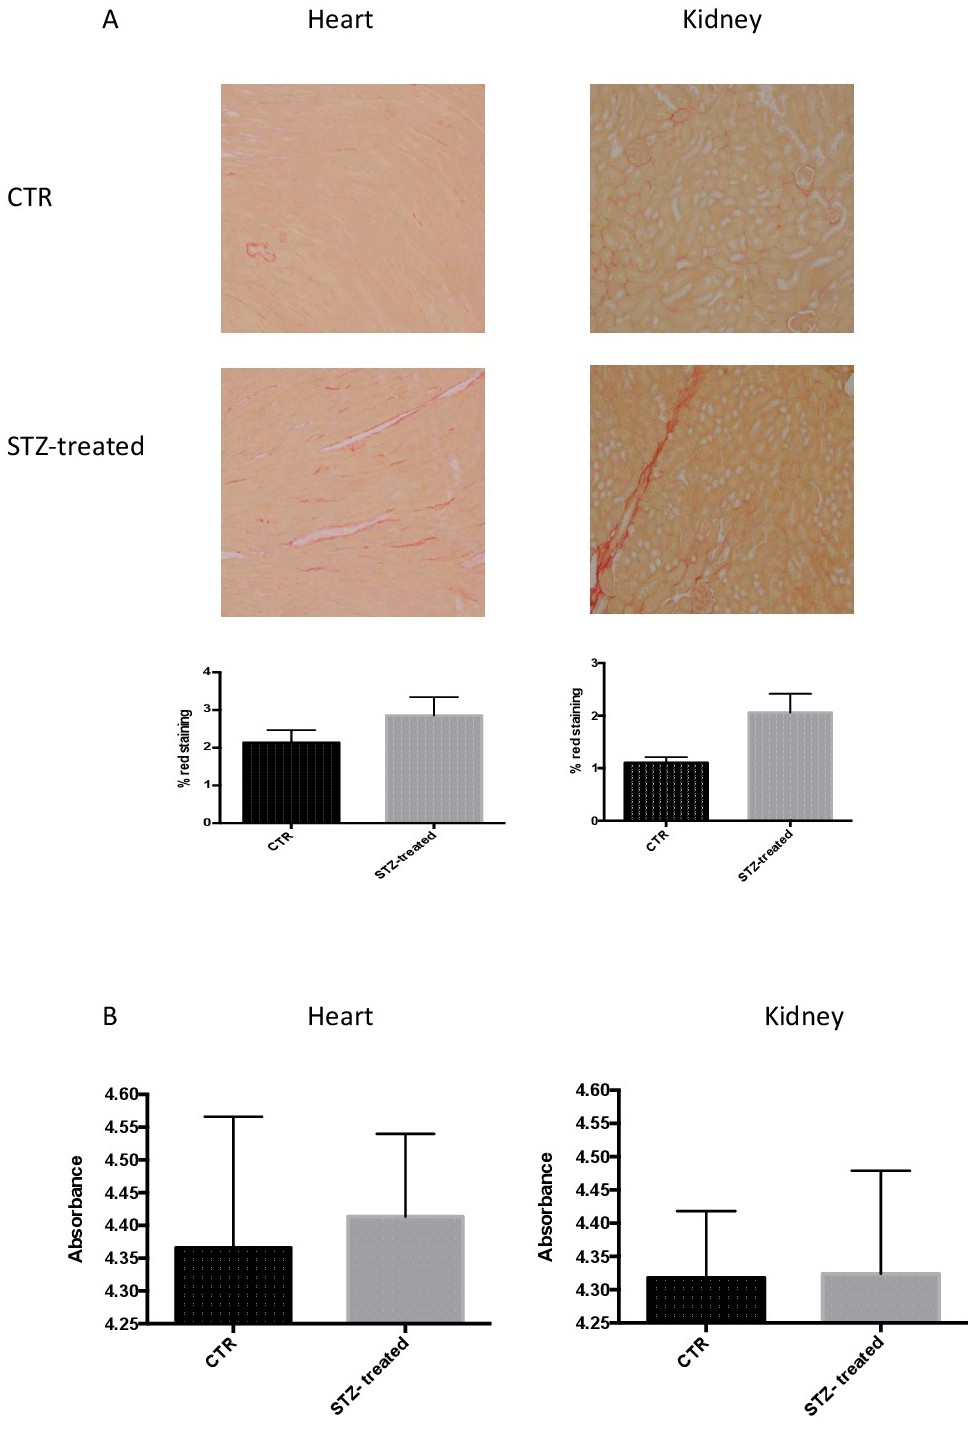
Fig. 4. Fibrosis analyses in heart and kidney of control and T1DM animals. (A) Sirius red histological staining of STZ-treated and control mice. Graphs illustrate the quantification of red stained area, shown in histological images. Magnification X200. (B) CTGF quantification by ELISA assay in both organs of STZ-treated and control mice.